
The hours of work it takes to pay for life's essentials have shifted dramatically over the past decade, even though an hour on the job feels exactly the same. Average pay is up about 47% since 2016, according to the Bureau of Labor Statistics, and prices overall rose about 40%. That should leave workers slightly ahead, and on average it does. But the bills that matter most did not move together. Buying a home, renting, health insurance, car insurance and gasoline all outran paychecks, while groceries, new cars and public college tuition actually take fewer hours today. Using official data from BLS, the Census Bureau, KFF, the Energy Information Administration and others, we compared 2016 with 2026 to show where each hour goes now, and why so many families still feel squeezed despite record household income..
Hours of work tell the real story

Paychecks are bigger than they were a decade ago. In September 2016, the average private sector worker earned $25.79 an hour, according to the Bureau of Labor Statistics. By September 2026, that figure had climbed to $37.81, a gain of about 47%. Over the same ten years, the Consumer Price Index rose about 40%, from 241.4 to 336.9. On paper, that means the average hour of work buys a little more than it used to. Yet millions of families say life feels harder, not easier. The answer hides inside the average. Some essentials, like groceries, a new car and college tuition at public schools, rose slower than wages. Others, especially owning a home, renting, health coverage, car insurance and gasoline, rose faster. To cut through the noise, this gallery turns official prices into hours of work, then compares 2016 with today. The results are not all bad, but the biggest bills tell a tougher story..
Yes, real wages did rise overall

Fairness starts with the good news. The Bureau of Labor Statistics tracks median weekly earnings for full time workers after adjusting for inflation. In the third quarter of 2016, that figure stood at $347 in 1982 to 1984 dollars. In the third quarter of 2026, it was $370, about 6.6% higher. The Census Bureau reported in September 2026 that real median household income reached $87,460 in 2025, which it called the highest on record since tracking began in 1967. Back in 2016, the Census Bureau put median household income at $59,039. So the typical worker is not poorer in total buying power than a decade ago. The catch is that gains this modest, spread over ten years, can be wiped out by a few bills that jump faster. And the Census Bureau also noted that income at the 10th percentile in 2025 did not change significantly from 2024.
The 2022 price shock still stings

The ten year averages hide a painful middle chapter. Inflation adjusted median weekly earnings peaked during the pandemic at $393 in the second quarter of 2020, a distortion economists link to many lower paid workers losing jobs and dropping out of the data. As prices surged, real earnings slid to $359 by the second quarter of 2022, according to BLS figures. In August 2022, the agency reported that the food at home index had jumped 13.5% in a single year, the largest 12 month increase since 1979. Wages caught up later, and real weekly earnings climbed back to $378 by the second quarter of 2026. Then the third quarter brought another dip to $370 as gasoline prices spiked. That pattern matters. Prices rarely fall back after a surge; they simply rise more slowly. Families remember the old price tags, and wage growth arrives in small raises long after the higher bills show up.
How many hours of work buy a home?
Home prices are where the hours of work comparison turns sharply against buyers. The National Association of Realtors reported a median existing home price of $234,200 in September 2016. In September 2026, the median was $417,500, up 1.3% from a year earlier. Divide those prices by the average hourly wage and the typical home cost about 9,080 hours of work in 2016. Today it costs about 11,040 hours, roughly 22% more labor for the same purchase. Measured against income, the gap is similar. A median home cost about four times the 2016 median household income. Using the Census Bureau's 2025 income figure, it now costs closer to 4.8 times. For first time buyers, that means saving longer for a down payment while rent eats into the same paycheck. NAR said first time buyers made up 31% of September 2026 sales.
Monthly hours of work for a mortgage soared
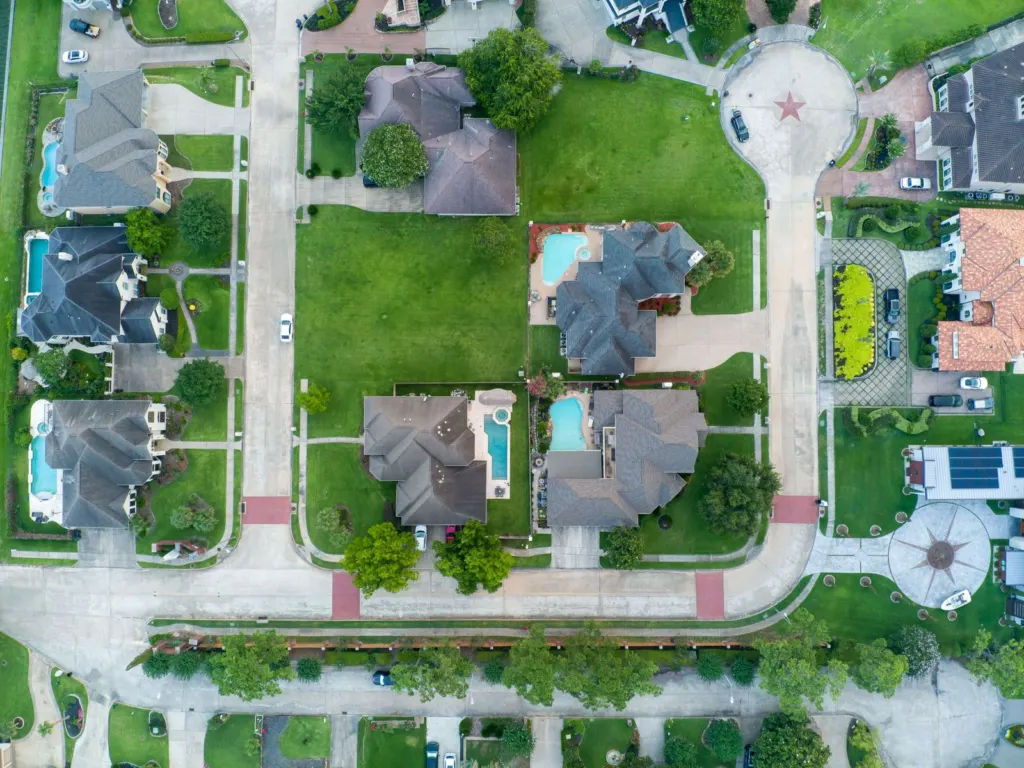
The sticker price is only half of the problem. In late October 2016, the average 30 year fixed mortgage rate was 3.47%, according to Freddie Mac. NAR reported the September 2026 average at 6.86%. Using those rates and a 20% down payment on the median home, the monthly principal and interest payment works out to about $838 in 2016 and about $2,191 in 2026. That is 32.5 hours of average pay each month a decade ago, compared with nearly 58 hours now, an increase of almost 80%. Taxes and insurance come on top. Harvard's Joint Center for Housing Studies found that average monthly home insurance premiums rose 72% between 2019 and 2025. Existing owners who locked in low rates are shielded, which is one reason homes rarely change hands. NAR chief economist Lawrence Yun said rising rates mean "fewer buyers can qualify to purchase a home."
Rent rose faster than paychecks
Renters did not escape. The Bureau of Labor Statistics index for rent of a primary residence climbed from 299.0 in September 2016 to 450.4 in September 2026, a rise of about 51%. Average hourly pay rose about 47% over the same stretch. That gap sounds small, but it means the same apartment now takes roughly 3% more hours of work each month, on top of years when rent spiked far faster than pay. The Joint Center for Housing Studies at Harvard reported that a record 22.7 million renter households, about 49%, were cost burdened in 2024, meaning they spent more than 30% of income on housing. Cheap units are disappearing too. The center found that apartments renting for under $1,000 a month fell from 8.3 million in 2014 to 5.8 million in 2024. There is some relief: national rents dipped 0.5% year over year in early 2026.
Groceries take fewer hours than you think

Here is the surprise in the data. The BLS food at home index rose from 238.1 in September 2016 to 321.8 in September 2026, an increase of about 35%. Wages grew faster, about 47%. So a grocery run that cost $100 in 2016 would cost about $135 today, but it takes roughly 3.6 hours of average pay instead of 3.9 hours. Over the past year, food at home prices rose just 1.8%, according to the September 2026 CPI report. So why do groceries feel so much worse? Shoppers see prices every week, and the 2022 surge left a lasting mark. Restaurant and takeout prices also climbed faster, with food away from home up 3.5% in the past year alone. And for lower wage workers whose raises trail the average, the grocery bill may not have gotten any easier at all. Averages do not pay anyone's bills.
Health insurance quietly swallows more hours of work

Health coverage is one of the biggest hidden costs in a paycheck. According to KFF's annual Employer Health Benefits Survey, the average family premium for job based coverage was $18,142 in 2016. In 2026, it reached $28,303, up 5% from 2025 and about 56% over the decade. Measured in hours, the full premium went from about 703 hours of average pay to about 749. Workers pay part directly, $7,471 a year in 2026, up 9% from 2025. That share takes about 198 hours of work, slightly fewer than the 205 hours it took in 2016. But economists generally note that employer spending on premiums comes at the expense of higher take home pay. KFF also found that single deductibles rose 34% over ten years. Over the past five years, family premiums rose 28%, compared with 26.9% wage growth and 24.4% inflation, KFF reported.
Childcare costs as much as college

For parents of young kids, childcare can be the single largest bill. Child Care Aware of America reported in May 2026 that the national average price of child care was $13,184 in 2025. At recent average wages, that is roughly 350 hours of work, close to nine full 40 hour weeks. The group said the price equals about 10% of median income for two parent households and about 33% for single parents. In every state with data, center care for two children cost more than median rent, it found. The BLS index for day care and preschool rose about 41% from 2016 to 2026, close to wage growth, so the problem is less about speed and more about the sheer size of the bill. "Families are being asked to shoulder costs that rival or exceed their biggest monthly expenses," said CEO Susan Gale Perry. Only 15% of eligible children receive federal subsidies, the group said.
A new car costs the same hours
Car shoppers may be surprised. Kelley Blue Book estimated the average new vehicle transaction price at $34,372 in September 2016. In September 2026, Cox Automotive reported it at $50,562, just under the record set in December 2025. That is a big jump in dollars, but almost exactly in line with wages. A new vehicle took about 1,333 hours of average pay in 2016 and about 1,337 hours now. The BLS new vehicle price index rose only about 23% over the decade, partly because the index adjusts for quality improvements, while transaction prices also reflect buyers shifting toward pricier trucks and SUVs. Owning the car is a different story. The BLS index for motor vehicle insurance jumped about 72% from September 2016 to September 2026, well ahead of pay, even after a 5% decline over the past year. Cox said affordability pressures are pushing more buyers toward lower priced vehicles.
Gas prices just reset the math
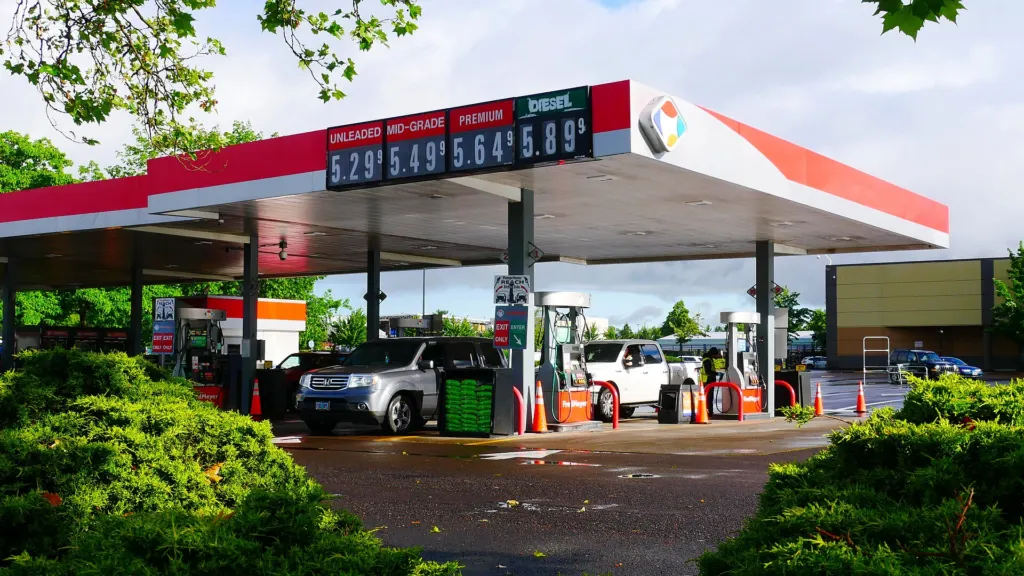
Energy is the newest shock. In the September 2026 Consumer Price Index, the Bureau of Labor Statistics reported that gasoline prices rose 34.2% over the previous 12 months and 9.1% in September alone, accounting for more than half of that month's overall increase. Energy prices as a whole were up 20.4% from a year earlier. Over the full decade, the BLS gasoline index nearly doubled, rising from 193.8 in September 2016 to 383.2 in September 2026. Because wages rose about 47% in that time, a tank of gas that once took one hour of average pay now takes roughly 1.35 hours. Commuters, rural families and delivery drivers feel this first, since they cannot easily cut back on driving. The spike also helps explain why inflation adjusted median weekly earnings slipped in the third quarter of 2026 after several quarters of steady gains.
Electricity bills kept pace with pay
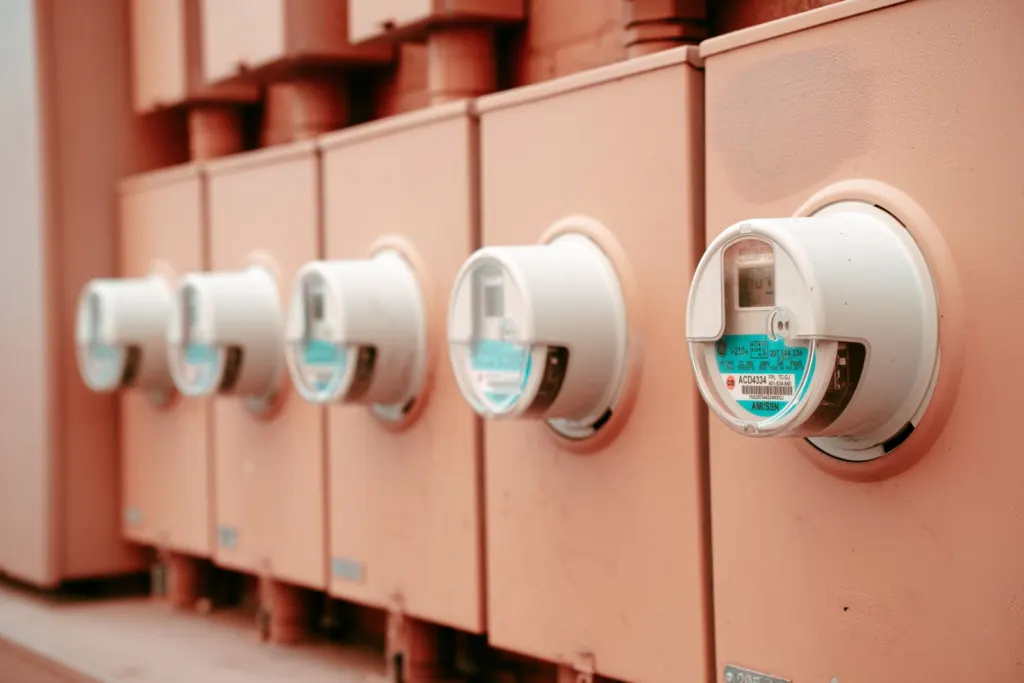
Power bills are rising, but the decade long picture is closer to even than many expect. The Energy Information Administration put the average residential electricity price at 12.5 cents per kilowatt hour in 2016, when the typical household spent about $1,351 on electricity for the year. In its October 2026 outlook, the agency projected an average of 18.2 cents for 2026, up from 17.3 cents in 2025. At 2016 usage levels, that works out to roughly $1,966 a year. Measured in hours of average pay, both bills land near 52 hours. The BLS electricity index rose about 45% over the decade, slightly below wage growth. The trend is still worrying. Electricity prices rose 4.4% over the past year, faster than overall core inflation, and households in hot or cold climates, or with older homes, use far more power than the average.
College tuition is the rare exception

One essential actually got cheaper in hours of work. The College Board reported that average published tuition and fees at public four year colleges for in state students were $9,650 in the 2016 to 2017 school year. For 2025 to 2026, the figure was $11,950. That works out to about 374 hours of average pay a decade ago and roughly 325 hours at recent wages. Private nonprofit colleges rose from $33,480 to $45,000, which also takes slightly fewer hours of pay than before. "Over the last 10 years, average tuition and fees in the public sectors increased less than inflation," said Jennifer Ma of the College Board. After grant aid, the average net tuition at public four year schools was about $2,300. Housing, food and books still push the full cost much higher, and the College Board noted that annual borrowing rose for the first time in 14 years.
Why hours of work still feel stretched
Put the numbers together and a clear pattern appears. The items that got cheaper in hours of work, such as groceries, electricity, new cars and public college, are either small, occasional or already bought. The items that got more expensive, mainly housing, health premiums, car insurance and fuel, are the largest and least avoidable bills in a household budget. A mortgage payment that takes 25 more hours of work each month can erase a modest real raise on its own. Averages also hide wide gaps. Workers whose pay trails the average, renters in fast growing cities and parents paying for childcare feel the pressure most. What comes next depends on mortgage rates, fuel prices and whether wage growth, running near 3.7% according to KFF, stays ahead of inflation, which was 3.7% in September 2026. For now, the hour feels the same, but it stretches unevenly.
Source: U.S. Bureau of Labor Statistics, Consumer Price Index, September 2026